
After taking a big hit in 2020, the U.S. meetings industry is beginning to show signs of a recovery. This post walks through the trajectory of the recovery to date to allow us to see where the industry is headed. We make some interesting state-by-state comparisons and examine if differing state regulations are impacting the rate of recovery. Finally, we provide action items for you to consider.
Let’s start with some takeaways:
- The numbers look better week over week.
- Most leads being generated are for smaller events.
- Each destination is performing differently based on the types of events it’s able to attract.
- State policies around COVID-19 restrictions have played a role, but there’s more to the story.
Let’s look at the data and see what it means for you. We used 2021 year-to-date customer relationship management (CRM) data from destinations.
Better numbers, smaller events
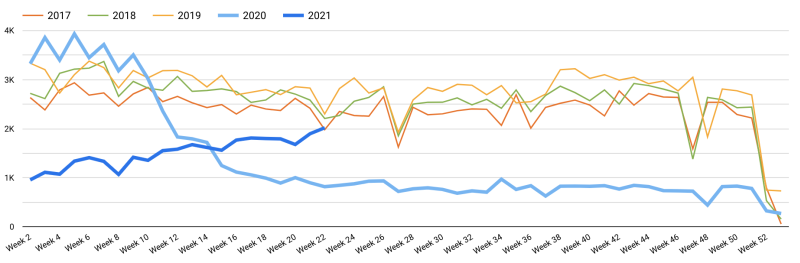
Bookings have begun to surpass cancellations more consistently in recent weeks, increasing the overall volume of bookings for 2021. The same trend holds true for leads. As seen in the chart below, while lead volume is still behind that of 2019, it’s trending up. This year’s steady climb puts lead volume ahead of the same time last year. The closest to 2019 levels we've been in over a year.
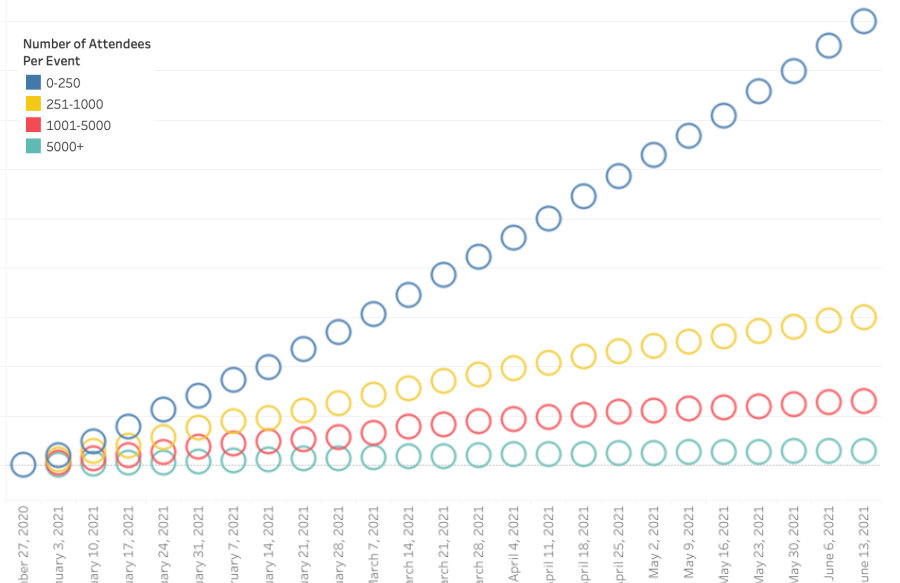
Before we compare states, it’s important to note that most of the leads coming in are for smaller events with fewer than 250 attendees, followed by events with groups of 251-1000 attendees, and then followed by events with 1001-5000 attendees. Events with 5000+ attendees have not increased much since the beginning of the year. The chart is an aggregate of all leads by number of attendees.
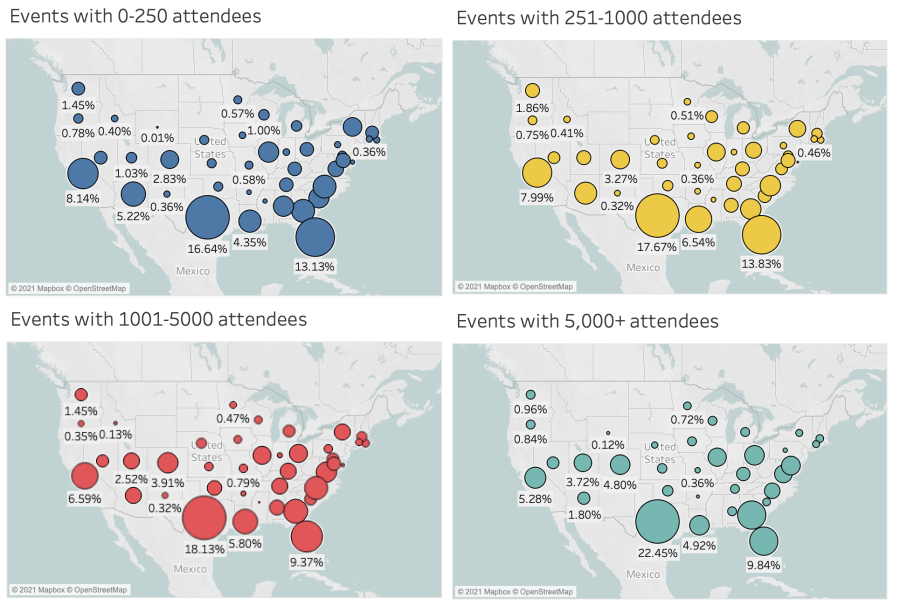
Mapping market share by number of attendees per event
The next set of maps shows that Texas and Florida have managed to sustain a strong market share for all types of event sizes. California is showing a smaller number of leads for larger events compared to its ability to attract smaller events; the same is true of Arizona. Alabama, South Carolina, and North Carolina have a smaller market share when it comes to large events. While Colorado, Georgia, and Louisiana attracted leads for smaller events, they succeeded in attracting them for larger events as well.
What effect have COVID-19 state regulations had?
At first glance, it seems like state regulations do influence the number of leads generated. Of course, that alone is not sufficient to reach levels seen in 2019. We suspect this is mainly because we still are in the process of recovery. There continues to be a high level of uncertainty around the future course of the pandemic, related policy responses, event organizer and participant behavior, and the economic recovery.
However, it does appear that in some cases, states that have been more open are positioned to recover more quickly, while acknowledging that the recovery will be years in the making.
To explore the theory that state policy might be affecting performance, we compared market share gains and losses for a few top-performing states. It should be noted that these changes are not large, but they are noticeable enough to see a trend.
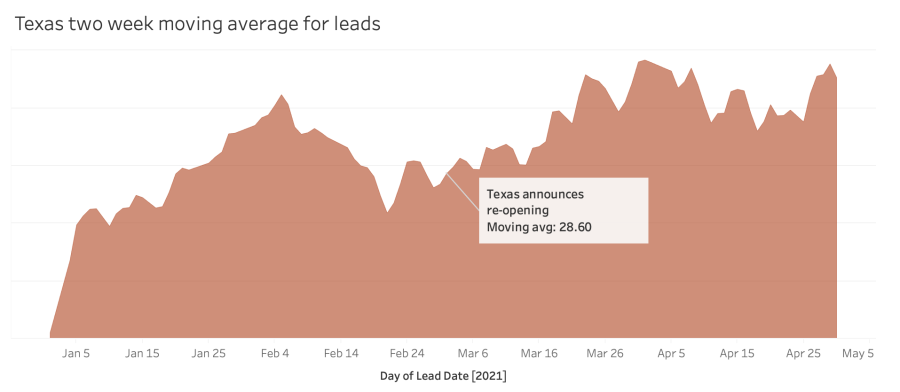
Let’s look at how Texas as a whole has performed in terms of generating leads. The graph below shows a two week moving average of lead generation. We can see that overall leads have been up and down this year; however, leads gained momentum after Texas announced re-opening.
States that gained market share in 2021: Texas, Florida, Arizona, Louisiana, South Carolina, Utah, Tennessee, Michigan. Of these, Michigan is the only state that had more restrictions on meetings and events.
States that lost market share in 2021: California, Illinois, Georgia, North Carolina, New York, Colorado, Ohio, Washington, Virginia, Alabama, Kentucky. Of these, Georgia, Ohio, Alabama did not have state wide restrictions yet saw a negative impact due to the current state of the industry.
It should also be noted that New York and Virginia had a variety of restrictions but did not have statewide restrictions. To learn more about state wide restrictions, this NPR article displays a very helpful map.
So while policy seems to be a factor, it’s not the only factor.
What This Means For You
Armed with this information:
- Make sure event organizers have all the information available in terms of policy and state regulations. That could allow your destination to garner more events.
- Remember that the recovery will not be an overnight one in the meetings market; this is a marathon, not a sprint.
- Data is your friend. Utilizing industry data will help you make strategic decisions to better position your destination for recovery.
- Let us know if you’d like to dig deeper into the data for your destination.