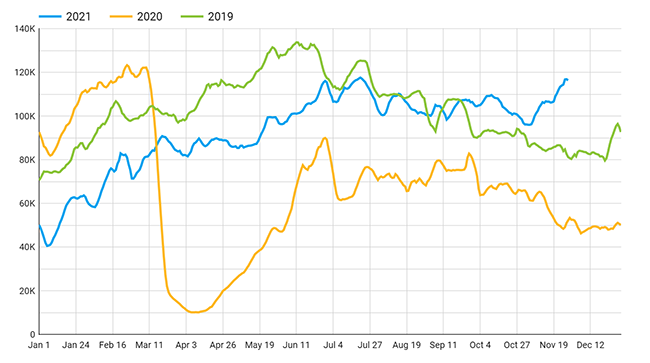
Daily sessions to North American DMO websites
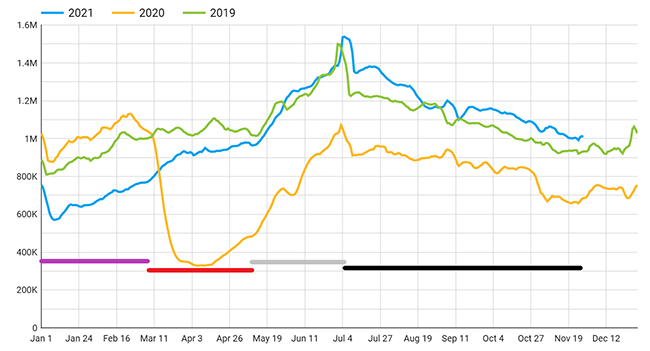
This year, I would divide the trend by sessions into four phases, three of which ran their course in the first half of 2021. I’ve marked them with the thick horizontal lines above.
Purple (January and February): The traffic hangover from 2020 continues, with 2021 coming in well below the line for 2019 and pre-pandemic 2020. Cases spike, vaccines are not yet widely available, and no one is sure when “normalcy” might return. Users stay away from DMO websites amidst the ongoing bad news.
Red (March through mid-May): Traffic climbs, approaching much closer to 2019 levels. We’re not really recovered, but the vaccines give people hope about travel.
Gray (May through June): Parity! We’re crushing 2020, but versus 2019, the industry is running even from the run-up to Memorial Day through the annual traffic peak on U.S. Independence Day. Maybe the vaccines mean we can expect a decent travel year ...
Black (July to present): … or even do much better. Traffic has been consistently up since July Fourth vs. 2019, and it shows no sign of going back down. Despite ongoing outbreaks and new variants, the public travels for leisure and uses DMO websites to plan their trips. From the perspective of our industry, web operations should be full speed ahead everywhere in the United States.
That’s all pretty exciting. The world may not have fully emerged from the crisis medically, economically, or politically, but that doesn’t seem to be a huge problem as far as travel is concerned. As destination marketers, we should be fully engaged with attracting our audiences to our destinations because evidently, they’re out there looking at their options.
Daily organic search sessions to North American DMO websites
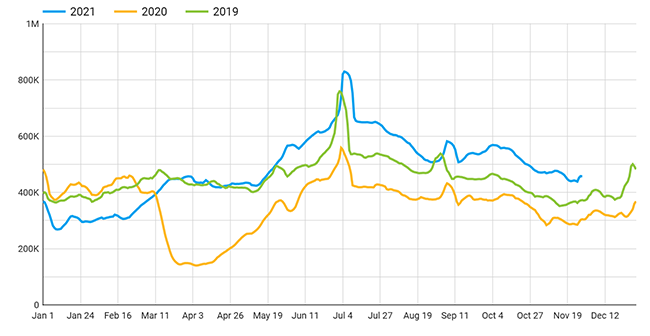
We’ll look at some breakdowns of traffic trends soon, but first, I want to put up the same chart from above but restricted to organic search sessions to reflect traveler interest in our sites more purely. Here the same trends are even more pronounced, which makes sense, as organic search provided more than half of all DMO sessions this year. Growth has been even stronger here than it has for all sessions since July Fourth.
Daily Book › Direct hotel partner referrals
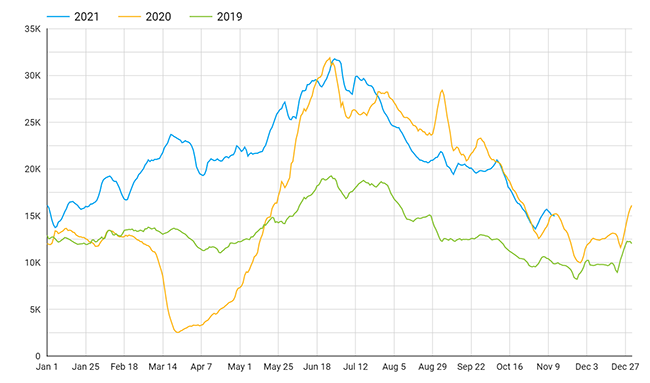
Sessions tell us about reach, but how about conversion? Lead generation, particularly for lodging partners, is one of the best ways a DMO can demonstrate its economic value to its constituents. Our Book › Direct referral engine allows us to track this activity across a wide range of destinations. While we haven’t enjoyed the same growth over 2020 that we have in sessions (this metric did oddly well during the pandemic), we’re keeping pace and blowing past 2019.
That is to say, all sessions on DMO websites are sending people to hotel partners as much as they ever have before, so it’s not just vanity metrics: we’re driving actual travel.
Daily organic search sessions to North American DMO websites 2021,
by user distance from destination
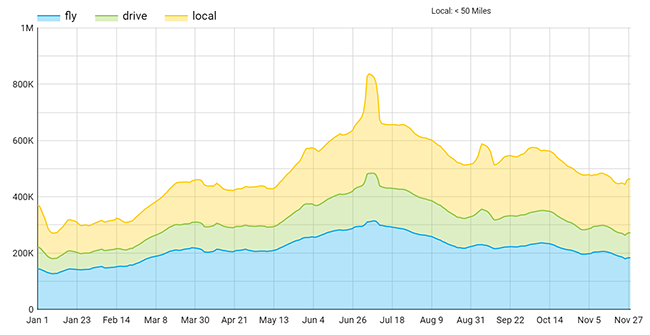
Let’s dig down deeper into the breakdowns we offer in our Client Portal. Here we see all organic search sessions for 2021 broken down by whether a user is more likely a local, a drive-market visitor, or a fly-market visitor (based on their distance to the destination whose site they’re viewing). The main thing to note here is the height of the yellow area for locals at the beginning of the year and the end. The early part of the pandemic kept locals away from our sites en masse, as they often come for information on events happening (whether they’re residents or visitors already in-market; the pattern is the same). With events mostly canceled in 2020, they didn’t seek much information from DMOs. Since the late-May Memorial Day holiday, though, that’s all changed: events have come back, travelers have traveled, and the yellow bar has grown in thickness, driving the significant growth we’ve seen throughout the second half of the year. The other segments have increased as well, but the real story has been the locals.
Daily organic search entrances to North American DMO websites 2021, to selected pages
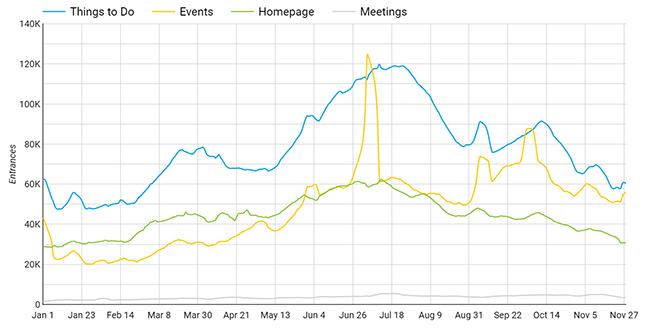
This visualization, showing a selection of the topics whose popularity we track on our sites, reinforces the trend seen above. As mentioned, locals tend to come to our sites for event information, and you can see how much Events content picked up after September’s Labor Day holiday in particular. Also of note, these pages are driving almost as much traffic as Things to Do, which was the usual trend before the pandemic.
I also want to highlight the little silver line for Meetings at the bottom. Meetings pages never drive bulk traffic to the sites we track, but the value of a single user can be much higher if it’s a meeting planner with a good lead to offer. These pages got crushed at the start of the pandemic, and they’re still only about 75% of the way back, but you can see they’ve been sloping up all year. We are getting more people into the top of the meeting sales funnel, so just a bit more good news may bring us back to normalcy in this critical market.
Daily paid search sessions to North American DMO websites
Lastly, let’s take a look at paid search sessions. DMOs wisely pulled and reserved their budgets for paid traffic when the pandemic hit, and until recently, they’ve been cautious about deploying them fully. But since organic user interest in DMO content has been normal for months, it’s finally become typical for DMOs to spend beyond 2019 levels since Labor Day.
We have more users coming to client sites naturally than ever before, so it makes sense for DMOs to use some of the government funding windfalls available to put themselves out there for every potential traveler they might persuade.
We could go on a lot longer breaking down trends in 2021 DMO traffic, and there are many visualizations in our public and private data repositories to help you do it. But the above should give you a good idea of the main developments for the year. Use this information to help explain your site’s performance to your stakeholders and plan your digital marketing activities for next year. Feel free to reach out if you’d like to know more about how your site fits into these industry trends; we love helping clients understand their performance and find opportunities to do even better.