Chances are you’ve seen plenty of blogs and videos on what to expect from Google Analytics 4 (GA4), but more than likely you now want to learn how to use GA4. If so, consider this blog your best friend. Here are some hot topic questions it will cover:
- What is GA4?
- What do the new metrics mean and are they comparable to Universal Analytics?
- How do I understand these metrics to provide value to my stakeholders?
- What do the new tools mean and provide for me?
- What are exploration reports?
Let’s start with the basics.
What is GA4?
Google Analytics 4 is an analytics service that measures traffic and engagement across websites and apps. It differs from Universal Analytics by offering a new event-based model for tracking user sessions across various devices efficiently, without relying on third-party cookies or requiring extensive coding with Google Tag Manager. GA4 is an intuitive platform designed for the future, offering detailed insights into site performance and content effectiveness.
What do the new metrics mean and are they comparable to Universal Analytics?
Unfortunately, they are not comparable, but don’t be alarmed — this is actually a good thing. A big metric you probably reported on pretty heavily was Sessions. Previously, this was tracked whether or not the page was even being actively engaged with, so a user could have the page open on a background tab and it would keep tracking, showing as if they were spending time on site with you.
Now, GA4 has added the engaged sessions metric to provide a better view of what action is taking place throughout the site. This is done by a user triggering one of the following three events:
- A session lasted 10 seconds or longer
- Had one or more conversion events; events need to be marked individually within the platform as a conversion you are tracking to trigger them
- Experienced two or more page views
For example, let’s say a user lands on your site, scrolls a bit, and finds an interesting piece of information they can click on for more. Boom. Engaged session. But, let’s say they landed and then immediately decided to search on Google for something else while your site is on in the background — this would then be marked solely as a session. Depending on your marketing objective it may make more sense to report on Engaged Sessions since it shows that you’ve brought value to the consumer.
Pro tip! Dividing engaged sessions from sessions is how you gain the Engagement Rate metric, which is the inverse of the Bounce Rate, thereby providing a much more positive and accurate view of how the site is performing for visitors.
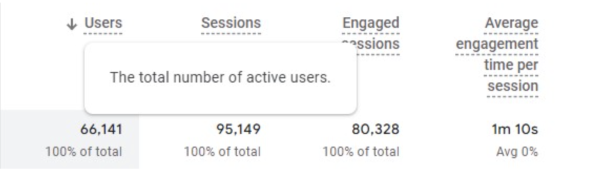
Another new metric added was Active Users — not to be confused with Users in Universal Analytics, which previously tracked total unique users who had an event. This new metric totals users who either have an engaged session, trigger the first entrance event, or have engaged time.
In GA4, active users may be lower than engaged sessions because one user can have multiple engaged sessions. You will need to decide to report on whichever metric makes the most sense for your marketing objective. But wait, you want to see what your total new visitors are. GA4 has now introduced a New User metric to track first-time visitors.
Pro tip! In the GA4 platform, though the metric is labeled as user, it is the Active User dimension.
How do I understand these metrics to provide value to my stakeholders?
Start by clearly defining your marketing objectives. This is crucial for providing value and demonstrating your site's success to stakeholders — like if you are running a new campaign that is meant to drive attention to your destination.
Pro tip! If you want more detailed tracking or only want to see a singular click, you can leverage Google Tag Manager and have it specifically marked in GA4 as an event.
What do the new tools mean and provide for me?
Some of the tools may seem familiar to you, but their use case may not be clear or may be overwhelming to decide when to use what.
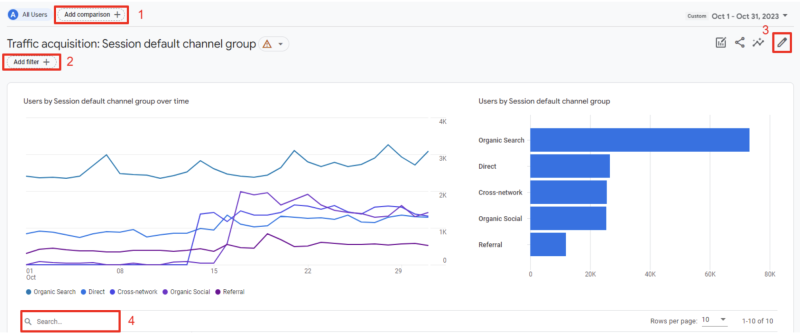
Here is the breakdown of their use case:
- “Add comparison” is used to either add a comparison view of two or more channels or only view a specific channel you are interested in investigating further, like organic or paid search
- You can utilize the filter if you are curious about how a specific section of a site, like “Things To Do,” is performing
- The pencil icon helps in modifying the report view. This can assist you in easily viewing the metrics in the order you would like them to appear or add metrics that may be missing in the report view you are in. For example, if you need to report on bounce rate, this is a metric you can add by clicking the pencil icon to reorganize the report though it is not recommended
- The search function is best utilized when seeking information on a specific channel, campaign, or landing page as this will pull it out for you individually
What are exploration reports?
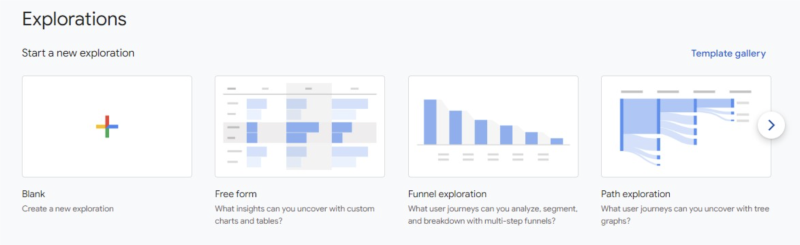
Exploration reports are a powerful tool for customized reporting. They will act as the best way to showcase your strategy’s performance because you can create them from scratch and tailor them to track a user’s journey across the site.
For example, let’s say you recently decided to focus on the outdoor enthusiast demographic and added many new trails and park pages. You could build a customized free-form report that only pulls in data on those particular pages. To take it a step further, you can decide on the segment you want to focus on — whether it's geolocation, channel, or device-related traffic. You can also decide on the individual dimensions and metrics you want to see based on what your goals and key performance indicators are.
Ultimately, GA4 is here to stay and support modern data analysis, addressing data privacy changes and cookie-based tracking challenges. Once you familiarize yourself and explore its capabilities, GA4 is user-friendly for both beginners and experienced users. To learn, start by posing a question about your site and seek relevant information with that in mind.
If you ever find yourself stumped, don’t hesitate to reach out, we’d be more than happy to set up some training time.