In the first post in this series, we looked at a digital marketing metric for measuring a DMO’s contribution to traveler awareness of the destination. Today, we’ll move further down the marketing funnel to look at ways to measure our contribution to traveler interest. That is, how can we put a number on how much we’re getting people to really think about coming to our area, even if they haven’t decided yet.
Of course, a perfect, all-encompassing, all-clarifying number is never going to be there. That’s the thing about numbers: they’re quick summaries of a great many things that happened, not detailed accounts of every relevant event. That’s good, because we can’t make decisions if we’re trying to understand every single thing that ever happened related to our marketing efforts; we would be overwhelmed by information. So we’re looking for something that gives us a good indication of what’s happening in general, even if we know it’s not telling us everything.
At Simpleview, we like to look at something we call engaged sessions when we’re measuring a DMO’s contribution to traveler interest. Regular sessions, which we explored last time as a measure for traveler awareness, are a good look at what a DMO specifically is doing to spread the idea that they’re even available as an option for travelers. Engaged sessions go a step beyond, indicating how many people are really digging into the content you provide and getting interested in going from potential visitor to actual traveler.
How do you define engaged sessions?
Engaged sessions are sessions in which the user viewed more than two pages and stayed longer than two minutes. Why these levels? Well, first of all, in the new mobile-centric era we live in, those standards are well above the DMO average. Secondly, it’s because the exact level doesn’t really matter. We need it to be high enough to cull out some of the truly less engaged users out there, and low enough that we still get a meaningful sample of our users. Whether these are the precise best criteria doesn’t matter so long as we understand that the absolute value of this metric (say, 15,000 engaged sessions last month) is less important than the trajectory of the metric (say, engaged sessions are up 12% year over year). With a requirement that a user view at least three pages across at least two minutes, we can be fairly sure that our engaged sessions are telling us something about the people who pause at least enough to consider whether our destination might be the one for their next trips.
Another important thing for a metric to be useful is that it needs to be different across different sites, channels and time periods. If it were the same for everything all the time, it wouldn’t give us actionable information. But here, too, things look very good for us. For this blog, I checked three sites at random for the same time period, and found that one had 28% engaged sessions, one had 10%, and one had 17%. That’s great! We found an almost three-fold difference between two sites without much effort, and good spread to the one in the middle as well. We can probably say with some confidence that one site is doing a better job of developing interest in the travelers who see it than the other is.
As always, we get the best insights when we dig below overall site averages. How about when we break it down by channel for one of the sites we looked at above?
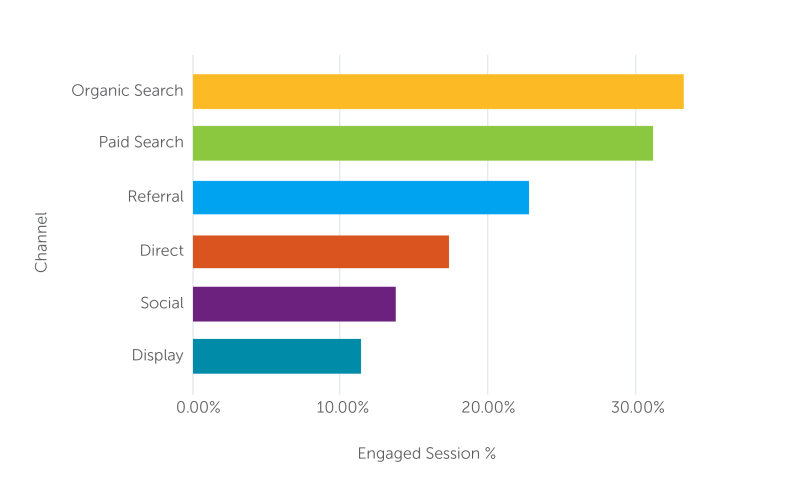
This, again, is good to see. Different channels have different engaged sessions levels, and the pattern fits our expectations. Organic search is highest, which fits normal patterns, and Display is the lowest. In fact, this metric highlights the differences between the channels much more starkly than the standard engagement metrics do: Organic search beats display by less than 2x in pages per session, and by only 2.6x in average session duration, but about by 3x in engaged sessions percentage.
Why do interest metrics matter?
When we extend our analysis from awareness metrics like total sessions to interest metrics like engaged sessions, we gain a deeper understanding of what our marketing efforts are truly doing, and exactly how they’re succeeding or failing.
For example, if you have a Display campaign bringing in a lot of bulk sessions, you can be pleased that you’ve made a lot of people aware that your destination is an option. But if those same sessions are not reaching your engagement thresholds often, you know that we still have more work to do to encourage actual visitation. Maybe you want to update your content, or discontinue that campaign and reallocate those funds toward something that ultimately puts more heads in beds.
In part three of this series, we’ll take a look at a metric for traveler desire, where we’re really getting close to fulfilling our mission.